Vlepis — Patient Monitoring App with BLE Sensors and AI Chat
A mobile app that connects to multiple Bluetooth Low Energy medical sensors — heart rate, SpO2, body temperature, ECG — and pulls their readings into a single live dashboard. An AI chat layer lets patients and clinicians ask questions about vitals history in plain language.
DigitalMonk built the mobile app and the AI chat feature. The BLE sensors themselves are the client's own hardware — we integrated with them, we did not design or manufacture them.

The Brief
The client had a set of BLE medical sensors — PPG for heart rate, a pulse oximeter for SpO2, a body temperature probe, and a multi-lead ECG device — each with its own connection protocol, its own data format, and its own companion app. A clinician checking on a patient had to open multiple apps, mentally stitch together readings from different screens, and had no way to look back at trends or flag anomalies without exporting data manually.
The ask was straightforward: one app that pairs with all the sensors, shows their readings in a single view, stores history, and gives both patients and clinicians a way to query that history conversationally — "What was my average SpO2 last week?" or "Flag any sessions where heart rate exceeded 120 BPM." The sensors already existed and were not changing; our job was the software layer that made them useful together.
What We Built
A React Native app that handles multi-sensor BLE pairing, live vitals display, ECG waveform streaming, session history with rhythm classification, trend charts, and an AI chat interface — all in a single mobile experience.
Live vitals dashboard
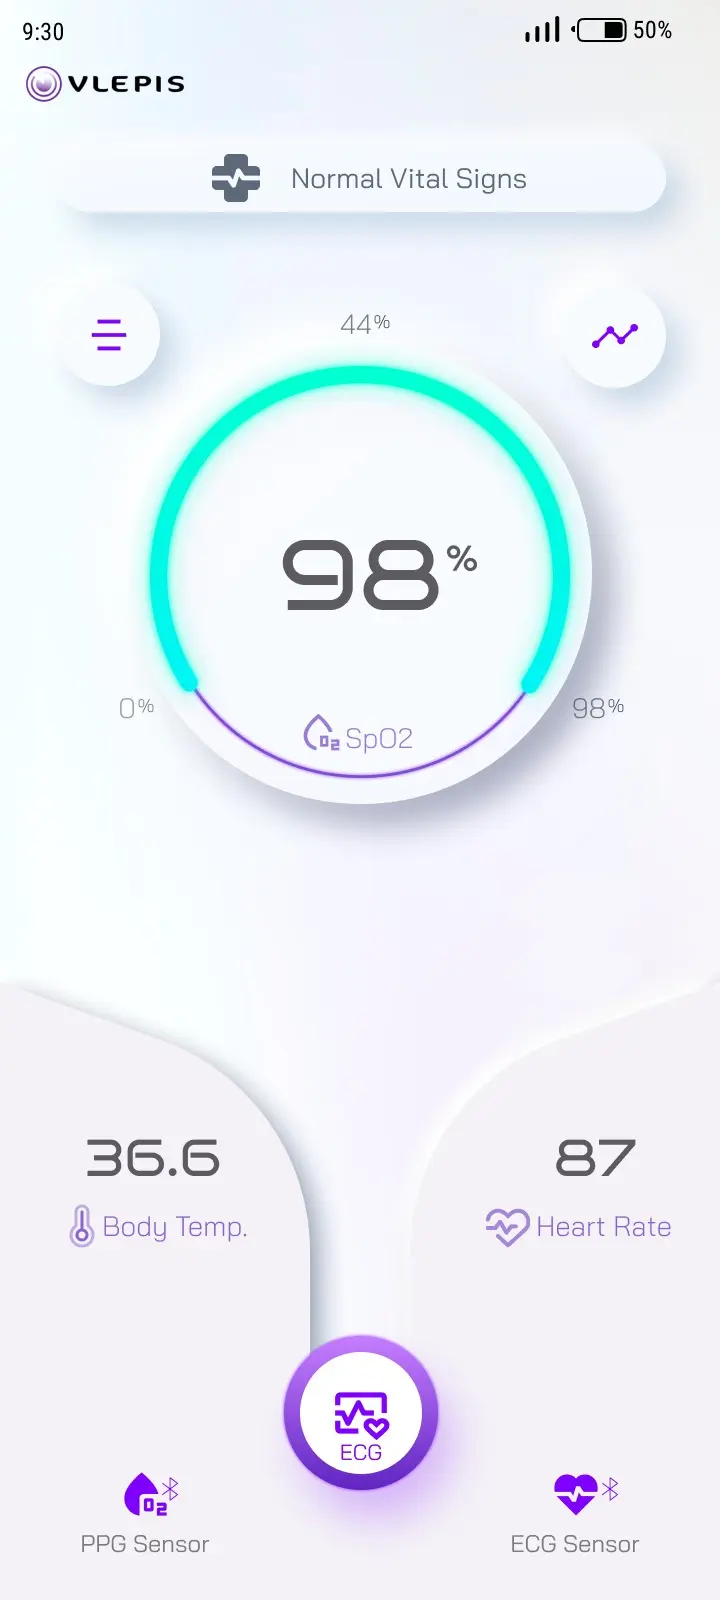
The main screen pulls live readings from every connected sensor into one view: SpO2 as a percentage, heart rate in BPM, and body temperature. Each value updates in real time as the sensor reports it. The goal was to replace the "open three apps and compare" workflow with a single glance — nothing more complicated than that.
Live ECG streaming
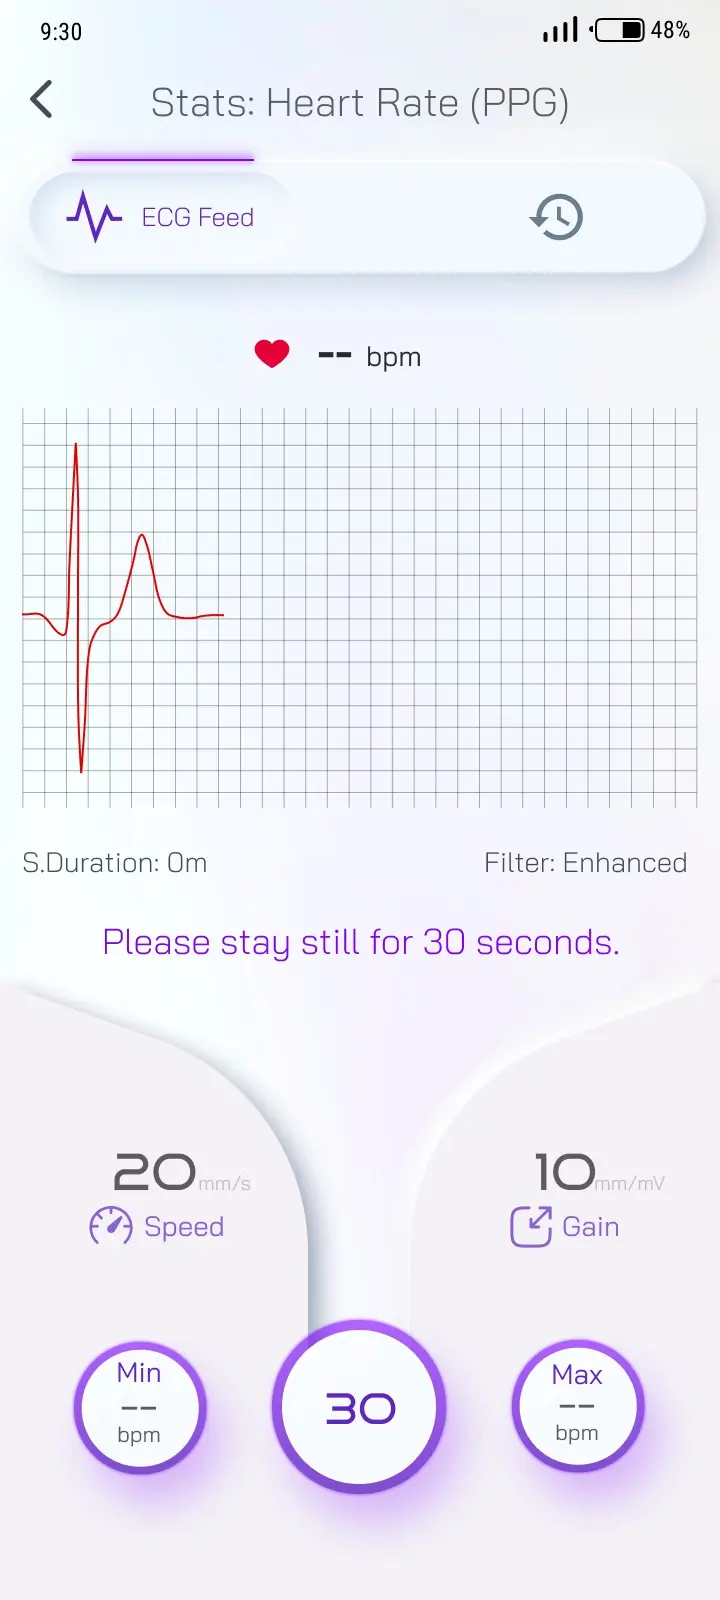
The ECG view renders a real-time waveform as samples arrive from the sensor over BLE. The user can adjust the sweep speed and signal gain — the same controls a clinician would expect from a bedside monitor, adapted for a phone screen. The stream runs continuously while the sensor is connected and recording, with no manual refresh needed.
BLE sensor pairing
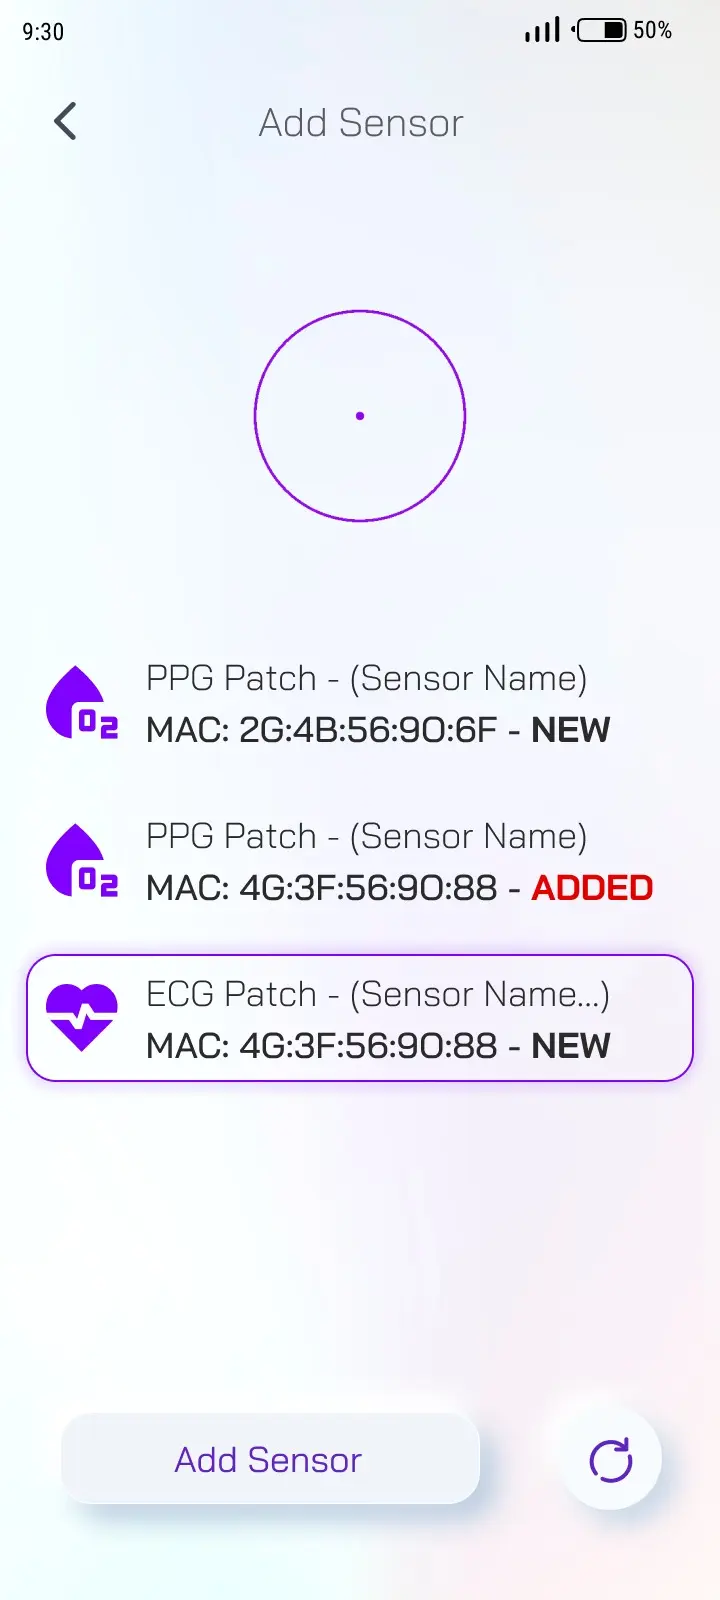
Each sensor is identified and paired by its MAC address. The pairing flow handles multiple sensors simultaneously — a patient can have heart rate, SpO2, temperature, and ECG devices all connected at once without conflicts. The app manages reconnection and sensor state so the user doesn't have to manually re-pair after a disconnection or app restart.
ECG session history
Every ECG recording is saved as a discrete session. The history view lists past sessions with a rhythm classification label — Sinus Rhythm, AFib, or Inconclusive — so a clinician can scan for flagged recordings without opening each one. The classification comes from the sensor's own analysis; the app displays it, it does not perform its own rhythm interpretation.
ECG session detail
Tapping into a session opens the full waveform with session metadata — duration, average heart rate, rhythm label. The recording can be downloaded or shared directly from this screen, which makes it straightforward to send a specific session to a physician or attach it to a patient record.
SpO2 trend tracking
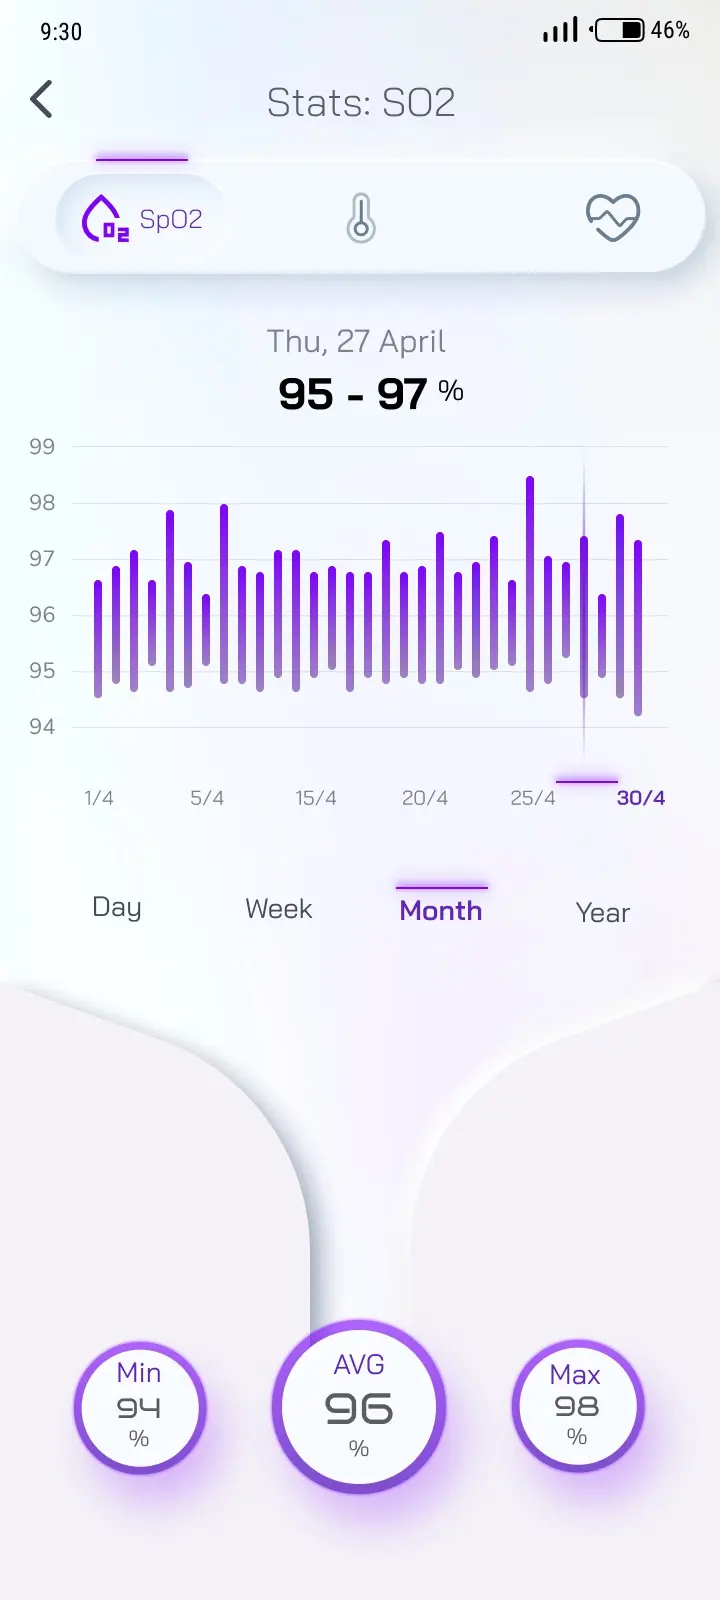
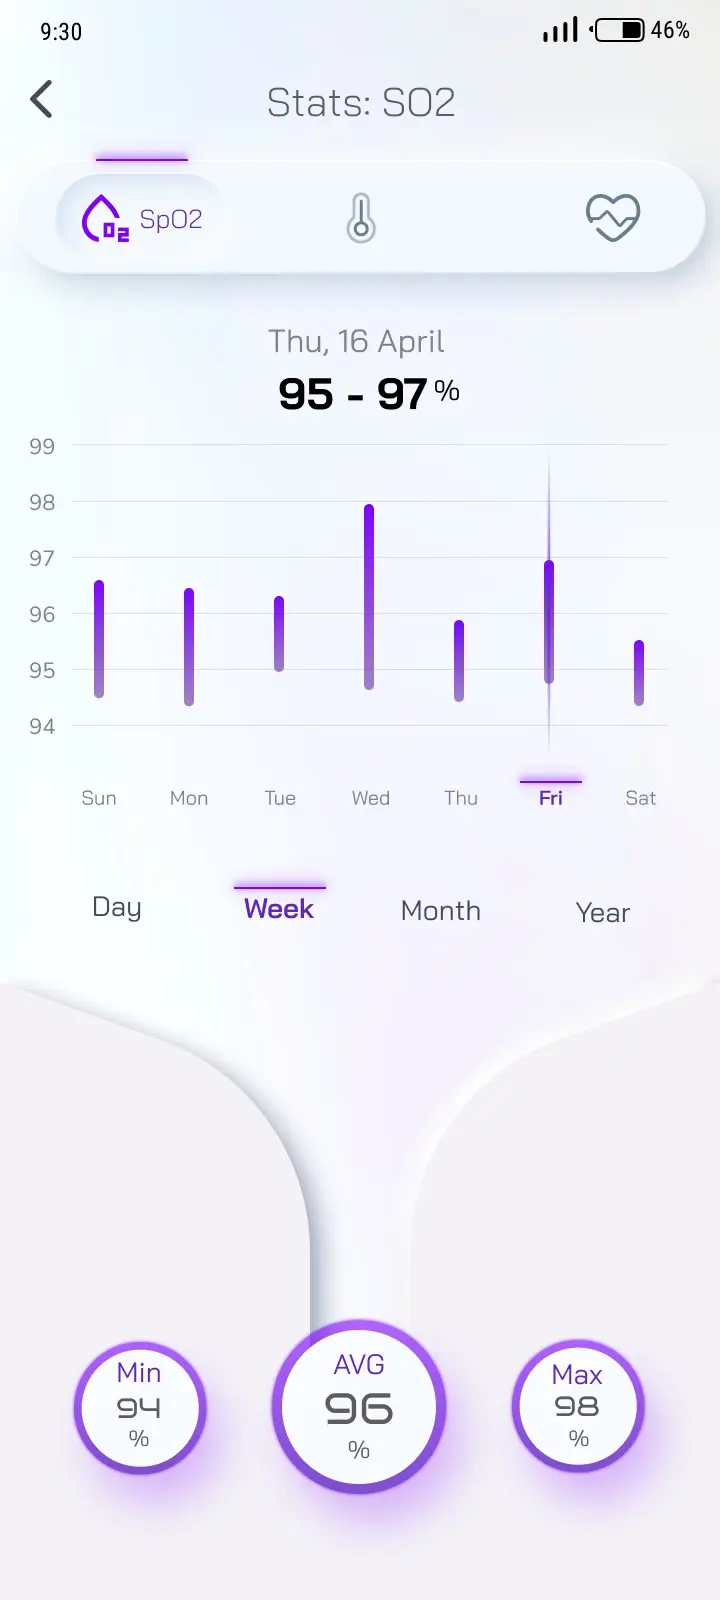
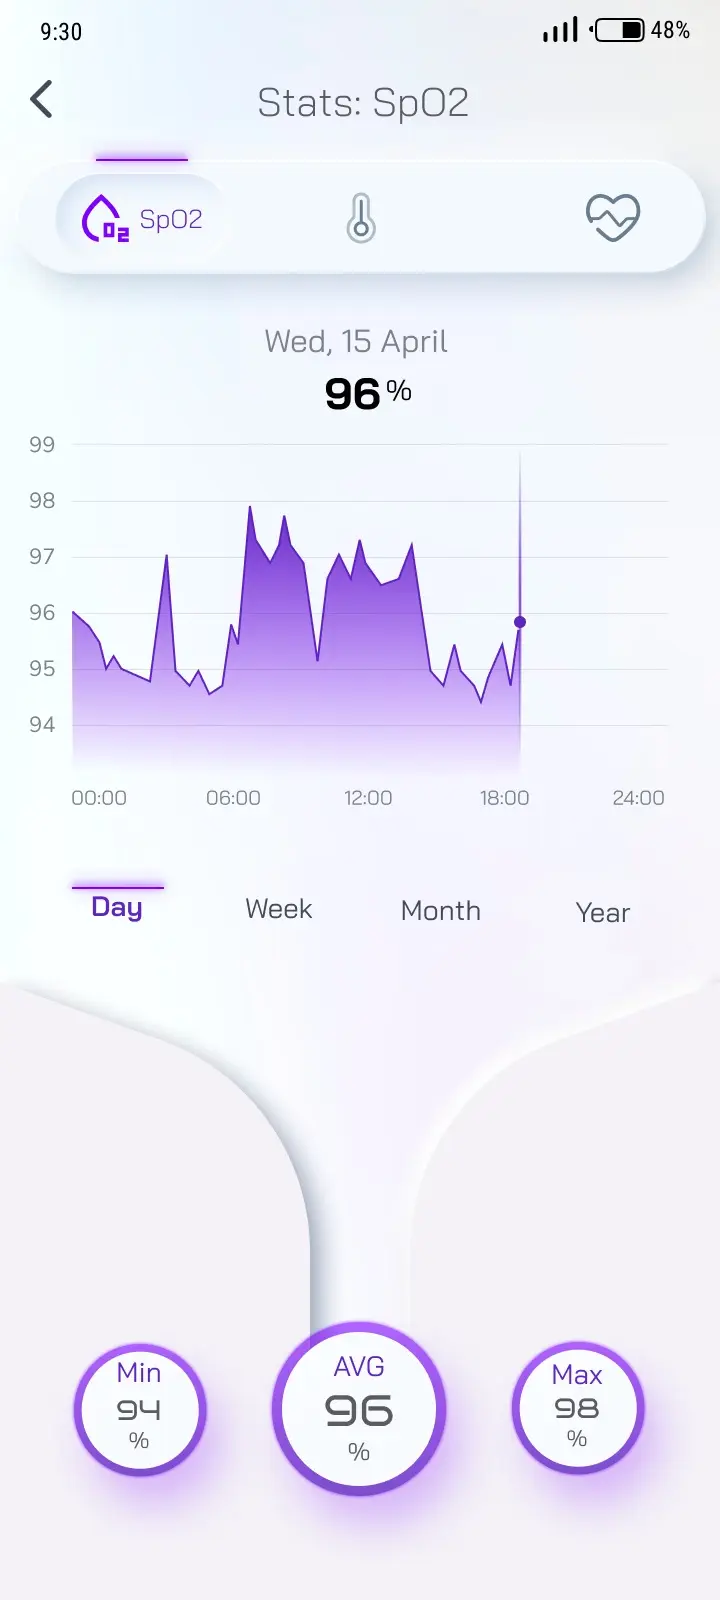
SpO2 readings are stored and charted over time, with toggles for day, week, month, and year views. A single low reading is noise; a downward trend over days is information. The chart makes that pattern visible without requiring the user to export data and graph it elsewhere.
AI chat for vitals history
The app includes a conversational AI layer that sits on top of the stored vitals data. It serves two audiences:
For patients: ask questions about your own history in plain language — "What was my resting heart rate this morning?" or "Show me my SpO2 trend for the past week." The chat retrieves and summarises the relevant data without requiring the patient to navigate charts or filters manually.
For clinicians: query a patient's history for flagged events or summarised trends — "Were there any AFib episodes in the last month?" or "Summarise this patient's vitals over the past 48 hours." The intent is to surface relevant data faster than scrolling through session lists, not to replace clinical judgement.
The AI chat retrieves and presents stored data. It does not generate diagnoses, treatment recommendations, or clinical interpretations — it is an interface to the patient's own recorded history, not a diagnostic tool.
Tech Stack
The app is built in React Native, targeting both iOS and Android from a single codebase. BLE communication uses a dedicated integration layer to handle the different protocols and data formats across the client's sensor hardware. Session data is stored locally on the device and synced as needed.
The AI chat feature integrates a large language model to handle natural-language queries against the stored vitals data. The specific LLM provider and integration architecture are part of the client's infrastructure and are not detailed here.
What Our Client Says
Why This Kind of Project Suits Us
Vlepis is a BLE integration and mobile app problem. The hard parts — pairing reliably with multiple concurrent sensors from different manufacturers, streaming real-time waveform data without drops, storing sessions with clinically meaningful metadata, and layering an AI interface on top of structured health data — are the same challenges in any connected-health product, regardless of which specific sensors sit at the other end of the Bluetooth link.
That's the work we do: taking a product idea through to a working, shippable app. This project sits within our broader electronics and embedded software development practice, alongside our experience in end-to-end embedded product development. If you have a connected-health or BLE sensor integration project that needs a mobile app, our BLE mobile app development practice is built for exactly that.
Have a Connected Health or BLE Sensor Project?
Whether you need a multi-sensor mobile app, real-time BLE data streaming, or an AI layer on top of health data, DigitalMonk can help turn your idea into a working product.